
Key figures
Inflation
Indicator description
Average change in the prices of goods and services purchased by households for own use, compared to the same period of the previous year. The consumer price index less 100 equals the inflation rate.
Source:
Summary tables (STADAT)
Latest data: –
GDP
Indicator description
Gross domestic product is the sum of gross value added produced by industries or sectors, valued at basic prices, and of the balance of taxes and subsidies on products, which cannot be divided by industry or sector, less financial intermediation services not divided by industry or sector. GDP volume change compared to the same period of the previous year is presented based on unadjusted data.
Source:
Summary tables (STADAT)
Latest data: –
Adjusted population
Indicator description
The full-scope censuses conducted every ten years show a comprehensive picture of the number and composition of the population. For determining the annual population number in the period between two censuses, the starting point is the population number of the last census (currently the census with the reference date of 1 October 2022), and from this, the population was estimated by using natural increase or decrease data available from the statistics of vital events until 2000. From 2001 international migration is also taken into account.
Source:
Summary tables (STADAT)
Latest data: –
Unemployment rate
Indicator description
The ratio of unemployed persons to the economically active population of corresponding age. The indicator can be calculated for different age groups, the default is the age group 15–74. Further selected age groups: 15–24, 25–54, 55–74.
Source:
Summary tables (STADAT)
Latest data: –
Employment rate
Indicator description
The ratio of employed persons to the population of corresponding age. The indicator can be calculated for different age groups, the default is the age group 15–64. Further selected age groups: 15–24, 25–54, 55–64 and 20–64.
Source:
Summary tables (STADAT)
Latest data: –
Industrial production
Indicator description
We measure changes of industrial production by variations of industrial production values, however the impact of price change is filtered out. We calculate the volume index of production based on comparative prices data of the industrial production value (presented at reference period price levels).
Source:
Summary tables (STADAT)
Latest data: –
Featured
HCSO Monitor
The collection of interactive figures provides up-to-date information on the latest domestic and international socio-economic trends.
The decisive part of the figures included in HCSO Monitor are downloadable in both image and data formats (PNG, SVG and CSV).
Feel free to browse the data in HCSO Monitor, updated many times a week!
Latest update: 02/04/2026
The decisive part of the figures included in HCSO Monitor are downloadable in both image and data formats (PNG, SVG and CSV).
Feel free to browse the data in HCSO Monitor, updated many times a week!
Latest update: 02/04/2026

We wish you a Happy Easter!
Easter is a movable feast, and its date varies from year to year. According to the decision of the Council of Nicaea (325), Easter Sunday falls on the first Sunday after the first full moon following the spring equinox. The earliest possible date is 22 March, a rare occurrence that last happened in 1818 and will not happen again until 2285. The latest possible date is 25 April, which occurs when the full moon falls after the equinox and the next full moon completing the lunar cycle falls on a Sunday – requiring an additional week of waiting. This last occurred in 1943, and the next such instance will occur twelve years from now, in 2038.
2026.04.02.
2026.04.02.
Regional Statistics, Volume 16, Number 2, 2026
The latest issue of the scientific journal features studies on the following topics: relative intensity methods for earthquake forecasting; adult learning and labour market outcomes; role of public services in maintaining the population of settlements; relationship between economic growth and income inequality; analysis of stability in the EU convergence clubs by using Poincaré plot features; mapping the regional AI; the impact of free health insurance targeting the poor; the effects of foreign direct investment and trade patterns on competitiveness in the European Union.
02/04/2026
02/04/2026

Born 100 Years Ago: László Papp, Three-Time Olympic Champion Boxer
László Papp – affectionately known as “Papp Laci” by the nation – was born on 25 March 1926. He won his first Olympic gold medal in the middleweight division at the 1948 London Games, then triumphed again in light middleweight in Helsinki (1952) and Melbourne (1956). With these victories, he became the first boxer in history to win gold at three consecutive Olympic Games. As a professional, he captured the European middleweight title in 1962 and went on to defend it six times. Out of his 29 professional bouts, he won 27, including 11 by knockout.
25/03/2026
25/03/2026

International Day of Forests, 21 March 2026
Since 2013, at the initiative of the United Nations, the International Day of Forests has been celebrated on 21 March, the first day of astronomical spring. The theme of the 2026 event is „Forest and economies”, highlighting roles that go beyond nature conservation, including energy and raw material production as well as the provision of jobs (and thus income). By the end of 2024, the forest area in Hungary had expanded to a century long record of 1.96 million hectares. Timber harvested from Hungarian forests was used in nearly equal proportions for industrial purposes and as firewood.
21/03/2026
21/03/2026

Map-Snap, 2024 – Territorial characteristics of the environment and the infrastructure
The Territorial characteristics of the environment and the infrastructure chapter of the Map-Snap, 2024 publication presents, among others, the state of Hungary’s natural environment, the extent of the transport network, the growth of the vehicle fleet, changes in the most significant indicators of public utilities and that of energy management. The installation of heat pumps became in 2024 the most common primary heating method for new dwellings in Hungary, their proportion increasing to 50% (from 42% in 2023), while gas heating decreased to 33% (from 45% in the previous year). The complete publication is available in Hungarian at: TÉR-KÉP, 2024 18/03/2026

Housing prices, housing price index, Q3 2025
After the sharp price increase recorded in the first quarter of 2025, the rise in housing prices continued at a more moderate pace in the second and third quarters. In the second quarter, housing prices were 18% higher than a year earlier, while in the third quarter they exceeded the previous year’s level by 21%. Over the same period, housing prices rose by 5.5% in the European Union and by 5.1% in the euro area.
The data source currently available does not yet allow for a detailed territorial or sub‑market analysis of housing market developments in the third quarter.
16/03/2026
The data source currently available does not yet allow for a detailed territorial or sub‑market analysis of housing market developments in the third quarter.
16/03/2026
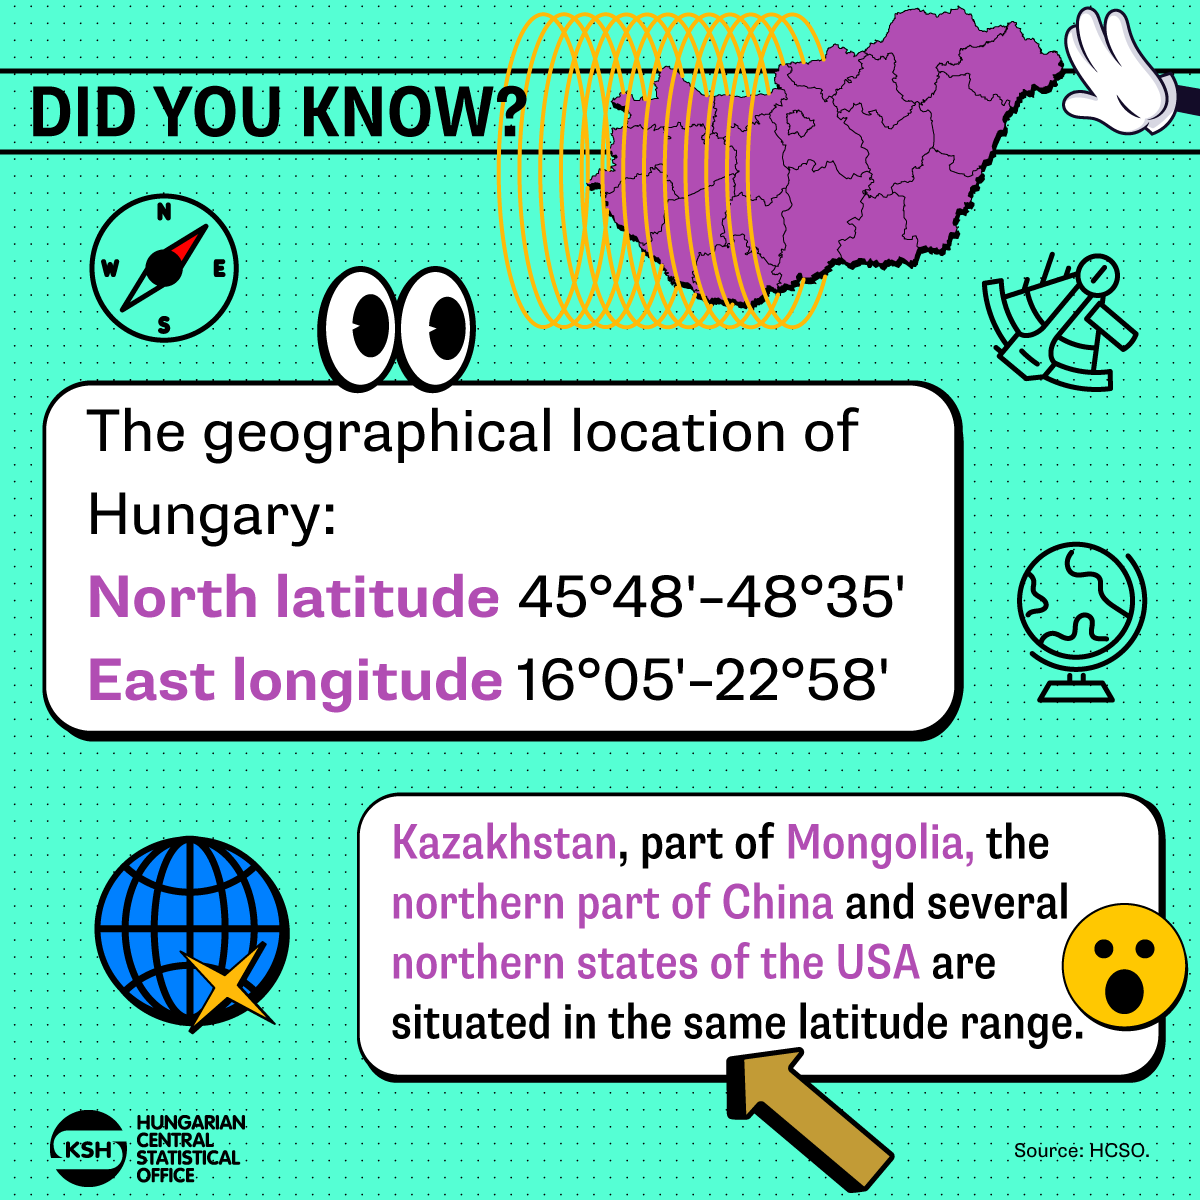
Did you know? – The geographical location of Hungary
North latitude: 45°48'–48°35'
East longitude: 16°05'–22°58'
Kazakhstan, part of Mongolia, the northern part of China and several northern states of the USA are situated in the same latitude range.
If you liked it, check out our data visualisations at this link: www.ksh.hu/datavisualisations
16/02/2026
East longitude: 16°05'–22°58'
Kazakhstan, part of Mongolia, the northern part of China and several northern states of the USA are situated in the same latitude range.
If you liked it, check out our data visualisations at this link: www.ksh.hu/datavisualisations
16/02/2026

15th March – Honour to the heroes!
The names of public spaces in Hungary’s towns and villages serve not only as points of orientation but also as part of the nation’s shared historical memory. Through their everyday use, they preserve the legacy of remarkable historical figures and events, including the Revolution and War of Independence of 1848–49.
Our interactive map presents streets, squares, and other public spaces named after the heroes of the events of 1848–49.
Honour to the heroes!
15/03/2026
Our interactive map presents streets, squares, and other public spaces named after the heroes of the events of 1848–49.
Honour to the heroes!
15/03/2026
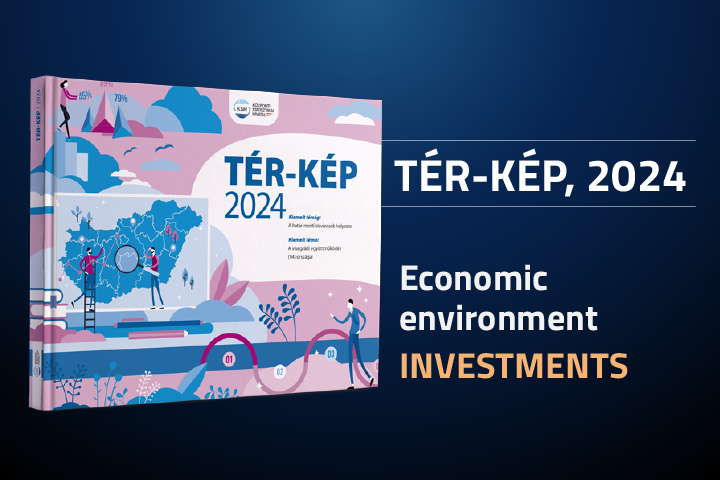
TÉR-KÉP (Map-Snap), 2024 – Economic Environment
The Economic Environment chapter of the TÉR-KÉP (Map-Snap), 2024 publication presents, starting from the territorial differences of GDP per capita the regional changes of the main economic indicators, such as the spatiality of investments and R&D, the survival potential and digitalisation level of enterprises. Budapest and Pest county used, within Hungary, 37% of the investment sources, the national average of the developments within economic organisations per capita was 1.3 million HUF. The complete publication is available in Hungarian at: TÉR-KÉP, 2024
12/03/2026
First releases
News, events
- 2025 Earnings Data Published in the Official Gazette, 11/03/2026
- This is how utility allowance is accounted in inflation statistics, 10/03/2026
- HCSO and Geostat Strengthen Professional Cooperation, 10/03/2026
- HCSO publishes February motor fuel price statistics, 06/03/2026
- Dr. Áron Kincses, President of the Hungarian Central Statistical Office, received a prestigious scientific award, 24/02/2026
